The path to greater profitability in e-commerce doesn't run through selling more — it runs through growing the money that stays in your pocket after each order. To do that, you first calculate the true cost of a single order — every line item: product, shipping, commission, advertising, returns, and operations — then compute your break-even ROAS; after that, you engage the levers of pricing, product mix, average order value, and repeat purchases one by one. Revenue is a metric; profit is the result: this guide gives you a roadmap for separating the two and systematically growing the money that remains in the bank.
One of the most common things we hear from the e-commerce accounts we manage is this: "We have sales, but I can't see any money at the end of the month." Revenue grows every month, order volume breaks records — yet the amount left in the bank stays flat or even shrinks. This isn't bad luck; it's a system failure. Growth decisions are usually made by looking at revenue, but revenue quietly splinters across dozens of cost items before anyone notices, and only a properly built cost table reveals what's actually left. The good news: profitability is not a matter of chance — it's a manageable equation, and you can influence every variable in it.
Why Does Profit Erode as Revenue Grows?
Let's first clarify the root of the problem. In e-commerce, the gap between revenue and profit doesn't close by itself as the business scales; more often than not, it widens. There are structural reasons for this:
- Advertising costs rise with scale. Early on, you reach the audiences that convert most easily; as your budget grows, you expand into more expensive and more hesitant audiences, and the cost of advertising per order climbs.
- Growth is usually bought with discounts. Promotions, coupons, and free shipping inflate revenue while quietly eroding margin. A 10% discount on a business with a 25% contribution margin means giving up roughly half of your profit.
- Marketplace commissions scale in proportion to revenue. The more you sell on Trendyol or Hepsiburada, the more you pay in commissions and service fees; this line item never "pays for itself."
- Return rates tend to rise alongside growth. New customers who don't yet know your brand return items more often than loyal ones; during aggressive growth phases, return costs turn into an invisible tax.
- Operating costs rise in steps. Beyond certain order thresholds, you need new staff, extra warehouse space, and new software subscriptions. These costs don't scale linearly the way revenue does — they jump, and each jump temporarily drags margin down.
A significant portion of these traps feed on the wrong foundations laid at the very start of the business; we examined the mistakes that are most expensive in detail in our post 7 Critical Mistakes When Starting an E-Commerce Business. Now let's move to the first and most important step of the solution: diagnosis.
Start with Diagnosis: Calculate the True Cost of a Single Order
The starting point of any profitability exercise is to honestly work out the end-to-end cost of a single order. This is called unit economics: the difference between the money that enters your register when an order comes in and the money you spend delivering that order to the customer. The situation we encounter most often with our clients is that "cost" is taken to mean only the purchase price of the product — yet the real picture is far more crowded. In our e-commerce consulting engagements, we spend almost the entire first week building this table, because every subsequent decision rests on these numbers:
| Cost item | What it includes | Commonly overlooked |
|---|---|---|
| Product cost | Purchase price, packaging, label, gift note | Waste, damaged goods, and the cost of capital tied up in inventory |
| Shipping | Outbound shipping, packing materials | Volumetric weight surprises and return shipping cost |
| Commissions | Marketplace commission, virtual POS (payment gateway) / iyzico-PayTR fees | Rising commission rates on installment sales |
| Advertising | Ad spend allocated per order | Agency and tool fees not being included in the ad cost |
| Returns and exchanges | Two-way shipping, repackaging, loss in value | Returned items that can no longer be sold |
| Operations | Warehouse, staff, software, accounting, e-invoicing | Being lumped under "overhead" rather than allocated per order |
When filling out the table, be sure to separate out VAT: the VAT embedded in your selling price is not your money and must not be included in the margin calculation. Let's look at a representative example:
- Selling price: 600 TL (VAT included) → after stripping VAT, approximately 500 TL net revenue
- Product + packaging: 220 TL
- Shipping (including volumetric weight): 60 TL
- Payment commission: 15 TL
- Advertising per order: 120 TL
- Return provision per order: 25 TL
- Operations allocation per order: 40 TL
What remains: 20 TL. In other words, the order that shows up on screen as a 600 TL sale is actually running at a 3–4% margin. A business that doesn't run this calculation may be scaling its losses by saying "more ads, more sales." The numbers will obviously be specific to your situation; what matters is filling in every line with your own real data — not estimates — and doing this table at the product level.
Break-Even ROAS: The Line Between Profit and Loss in Advertising
Once your unit economics table is ready, you can calculate the single most critical number on the advertising side: your break-even ROAS. This is the point at which your ad spend pays itself back with zero profit. The formula is simple: divide the selling price by the contribution margin left after deducting all costs except advertising. If your contribution margin is 25%, your break-even ROAS is 4 — any campaign that generates less than 4 TL in revenue for every 1 TL you spend on ads is losing you money.

The typical mistake we see in the accounts we manage is being deceived by a ROAS that "looks good" in the ad panel. If the panel shows 3.5 while your break-even point is 4, your losses grow as you scale the campaign. The second common mistake is confusing platform ROAS with total ROAS (total revenue ÷ total ad spend); ad platforms tend to measure their own contribution generously, which is why you need to look at both numbers when making decisions. We explained step by step how ROAS is calculated, how to set a target ROAS, and the gap between panel and reality in our post What Is ROAS and How Is It Calculated?. The rule here is clear: don't increase your ad budget without knowing your break-even ROAS.
Pricing: The Fastest Lever for Profit
Price is the most powerful — yet least used — variable in the profit equation. The math is striking: on a product with a 25% contribution margin, a 5% price increase grows profit by roughly 20% if unit sales don't change at all, because the entire increase goes straight to the profit line. Demand is sensitive to price, of course — but most of our clients vastly overestimate that sensitivity without ever testing it, and end up working with prices that are too low for years.
- Test in stages. Rather than raising prices across the entire catalog at once, monitor small increases on your 3–5 bestsellers for a few weeks. If unit sales don't drop meaningfully, your prices were below where they should be, and the profit in between has been left on the table all along.
- Discipline your discounting. Constant promotions train customers "not to buy at full price." Compress your discount calendar to a few periods per year and calculate the margin impact of every coupon code before it goes live.
- Pass on cost increases without delay. A business that takes months to reflect currency, shipping, and commission rate increases in its prices is financing the gap out of its own pocket.
- Strengthen your value communication. It's the product page that carries the price: professional imagery, a clear articulation of benefits, genuine customer reviews, and trust signals all make the same product sellable at a higher price.
- Use psychological thresholds, but don't overdo it. Price points like 499/500 work; that said, what creates lasting profit is a well-positioned value proposition, not perception tricks.
Product Mix: The Revenue Champion Isn't Always the Profit Champion
Not every product in your catalog does the same job: some carry revenue, some carry profit. The problem is that most businesses allocate their ad budget and showcase space exclusively to whatever "sells the most." But when you break out contribution margin at the product level, the picture is often reversed. A representative comparison:
| Metric | Product A — Revenue Champion | Product B — Profit Champion |
|---|---|---|
| Monthly sales (units) | 400 | 120 |
| Unit price | 450 TL | 800 TL |
| Contribution margin | 12% | 38% |
| Return rate | High | Low |
| Monthly net contribution (indicative) | ≈ 21,600 TL | ≈ 36,480 TL |
Product A is in the spotlight, the star of every ad, the team's pride — but it's Product B that quietly puts money in the register. Three practical actions follow from this analysis:
- Shift your ad budget toward profit champions. Products with a low break-even ROAS (i.e., high margins) offer a much wider safety margin in advertising.
- Use the revenue champion as an entry point. Win the customer with the affordable, popular product, then move them toward high-margin products through cross-selling and email flows.
- Boldly cut products whose margin can't be rescued. A product whose contribution stays negative even after pricing corrections and bundling attempts is a burden occupying your warehouse space and cash flow.
Raise Average Order Value: More Profit from the Same Ad
Shipping, packaging, and per-order advertising costs are largely fixed; as the cart grows, these fixed costs dissolve into a larger revenue base and margin improves automatically. When the cart is 500 TL, a 60 TL shipping cost is 12% of revenue; when the cart is 900 TL, it drops to 7% — a 5-point margin gain with no cost cutting whatsoever. Proven ways to raise average order value:
- Cross-selling: Suggest genuinely complementary products on the product page and in the cart (a screen protector alongside a phone case, for example); irrelevant suggestions erode trust.
- Bundle structures: Group frequently co-purchased products into a single bundle with a slight price advantage; perceived value rises while margin is preserved.
- Free shipping threshold: Set the threshold a reasonable distance above your current average order value; customers will add items to the cart to reach it.
- Quantity incentives: For consumable products, a "discount on the 2nd item" structure accelerates both cart size and inventory turnover.
- Post-purchase offer: A small complementary product that can be added with one click immediately after checkout generates incremental revenue at zero advertising cost.
Turning every cart addition into a completed purchase is a separate challenge; we've compiled the ways to recover orders lost at checkout in our cart abandonment reduction guide.
Conversion Rate Is Also a Profit Lever
Getting more orders from the same traffic directly lowers the cost of advertising per order: if your conversion rate doubles, your advertising cost per order is halved, and that difference goes straight into your margin. Site speed, product page quality, checkout simplicity, and trust signals are the foundation here. We won't go deep on this topic now; you'll find 14 concrete tactics in our conversion rate optimization (CRO) guide — it should absolutely be part of your profitability plan.
Reduce Returns: The Silent Profit Drain
A return doesn't just wipe out the profit of one order — it often wipes out several: two-way shipping, repackaging, loss in product value, and customer service time all pile up. What's more, return costs often don't appear as a single line in most reports, so they can silently erode profit for years without being noticed. The essence of reducing return rates is expectation management — the customer should find exactly what they expected at the door:
- Set expectations correctly: Photos and video shot in real lighting, a clear sizing chart, and fabric/material information. A visual that makes the product look better than it is generates short-term sales and long-term returns.
- Add a fit and size guide: In apparel and footwear, sizing tops the list of return reasons; make the "runs small/large" feedback from reviews visible on the product page.
- Strengthen packaging: Returns due to shipping damage are entirely within your control and are the easiest type of return to reduce.
- Classify return reasons: In most businesses, a large share of returns comes from a small number of products. Fixing the root cause (wrong image, fit issue, supply quality) reduces the rate permanently.
- Encourage exchange over refund: A smooth exchange process and a small gift voucher keep the money inside the business instead of going out as a refund.
The Real Source of Profit: Repeat Purchases and CLV
In most e-commerce businesses, the first order is roughly break-even after advertising costs; the real profit comes from second and subsequent orders that arrive without advertising spend. For this reason, the heart of a profitability strategy is built on customer lifetime value — CLV. A business that works with one-time customers must acquire new customers from scratch every month; a business with strong repeat-purchase habits uses advertising only to acquire new customers, and generates its profit from a loyal base.
- Build a permission-based contact list: Obtain email and SMS consent in compliance with regulations. On a marketplace this is impossible; on your own site it is your most valuable asset.
- Activate automation flows: A welcome series, a post-purchase thank-you with usage tips, a reminder as the consumption period nears its end, and a re-engagement message for customers who haven't ordered in a while. These flows are set up once and run for years.
- Segment: Your top 10–20% of customers carry a disproportionate share of your revenue and profit; offer them early access, exclusive perks, and priority support.
- Trigger the second order: The window between the first and second orders is the most critical period; even a small thank-you note inside the package and an exclusive offer for the second purchase can meaningfully move the repeat rate.
We covered how CLV is calculated and how to structure loyalty programs in our Customer Loyalty and CLV guide, and the technical setup of these flows in our email marketing and automation guide.
Marketplace or Your Own Site? Managing the Margin Gap
A significant portion of businesses selling e-commerce in Turkey do so through Trendyol and Hepsiburada — rightly so, since the traffic is already there. But through a profitability lens, there is a structural margin gap between the two channels. On a marketplace, commission rates that vary by category are compounded by shipping participation fees and service deductions; price competition constantly pushes margin down, and because customer data largely stays on the platform, you can't manage repeat purchases yourself. On your own site, virtual POS (payment gateway) commissions are generally well below marketplace deductions, and the infrastructure fee is a predictable fixed cost; in exchange, generating the traffic is your responsibility.
The right question isn't "which one?" but "which job goes to which channel?" The healthiest model we've seen across the brands we manage is this: the marketplace is the new-customer discovery and volume channel — only be present there with products whose margin can sustain it; don't sell unprofitable products at a loss for the sake of "visibility." Your own site should be the center of margin and repeat purchases: customer data stays with you, CLV flows run, and campaign design is in your hands. For comparing payment commissions, see our virtual POS commission comparison; for platform selection, see our ikas vs. Shopify guide. Subject to marketplace rules, making your brand memorable through packaging, brand experience, and product quality is what makes customers search for you directly the next time.
A 30-Day Profitability Plan
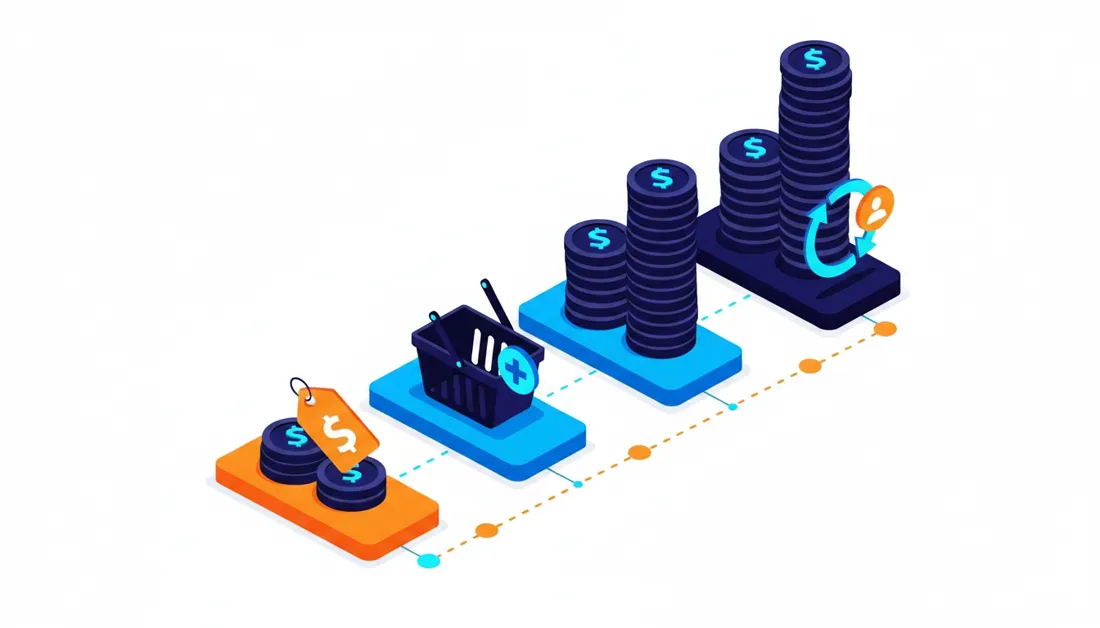
Trying to pull all these levers at the same time is the second most common mistake; the first is not starting at all. Here is a realistic four-week plan with a deliberately considered sequence:
- Week 1 — Diagnosis: Take stock of costs, build the per-order unit economics table, and calculate contribution margin and break-even ROAS at the product level. Don't change anything this week — just measure.
- Week 2 — Ad cleanup: Pause or restructure campaigns and products running below break-even ROAS; shift the budget to profit-champion products. In most businesses, the fastest profit gains come this week.
- Week 3 — Pricing and cart: Start gradual price tests on bestsellers, move the free shipping threshold above average order value, and launch the first cross-selling and bundle structures.
- Week 4 — Retention: Classify return reasons and make the first root-cause fix, activate email/SMS automation flows, and establish a weekly profit reporting routine.
After the plan is complete, the sustainable part of the work is a measurement routine. Check five numbers every week: net contribution margin, total ROAS distance from break-even, average order value, return rate, and repeat purchase rate. If these five numbers are moving in the right direction, the shape of the revenue chart is a secondary detail.
You can apply this plan on your own; however, having an experienced eye that sees the picture from the outside gets you there much faster. At Alis Dijital, our e-commerce consulting service does exactly this: we build out your unit economics, calculate your break-even ROAS, and rebuild your pricing, product mix, and ad decisions around profit. If you'd like to learn more about what the consulting model covers, who it makes sense for, and our 2026 pricing framework, take a look at our consulting guide; for a business-specific assessment, you can fill out the free analysis wizard in just a few minutes.